DataDog Based Analytics Solution For API Manager
Deployment
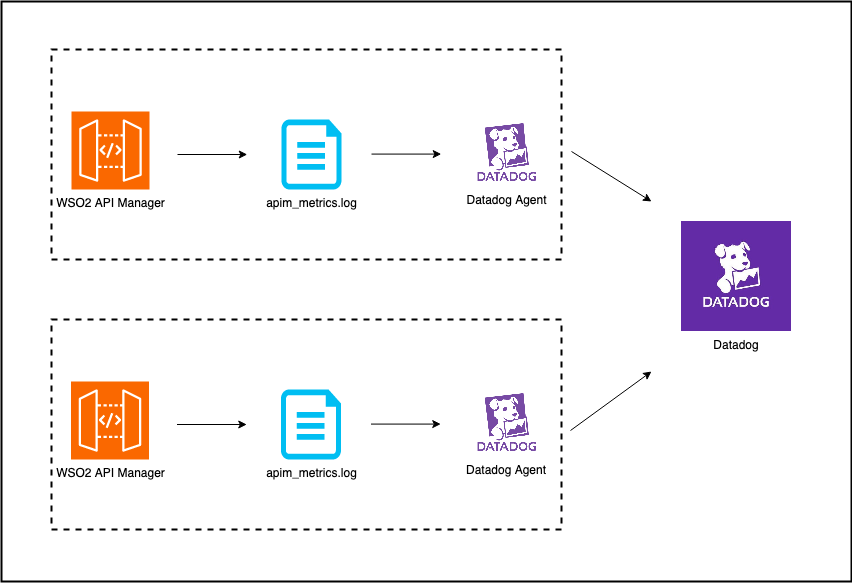
As explained in the above deployment diagram, API Manager analytics will be written asynchronously into the apim_metrics.log file.
The log file will be read by the Datadog agent and published the data into the Datadog analytics platform.
In the Datadog end a pipeline is created to pre-process the data. This pipeline tokenizes the log into attributes, which are then converted into facets. The purpose of this is to allow for the creation of dashboards.
Step 1 - Configuring API Manager
Step 1.1 - Configuring the deployment.toml file.
Specify the type as log to enable Datadog analytics as shown below.
Edit apim.analytics configurations in the deployment.toml file located inside the wso2am-4.x.x/repository/conf directory with the following configuration.
[apim.analytics]
enable = true
type = "log"
Step 1.2 - Enabling Logs
To enable logging for a reporter, edit the log4j2.properties file located inside the wso2am-4.x.x/repository/conf directory.
-
Add APIM_METRICS_APPENDER to the appenders list:
appenders = APIM_METRICS_APPENDER, .... (list of other available appenders) -
Add the following configuration after the appenders:
appender.APIM_METRICS_APPENDER.type = RollingFile appender.APIM_METRICS_APPENDER.name = APIM_METRICS_APPENDER appender.APIM_METRICS_APPENDER.fileName = ${sys:carbon.home}/repository/logs/apim_metrics.log appender.APIM_METRICS_APPENDER.filePattern = ${sys:carbon.home}/repository/logs/apim_metrics-%d{MM-dd-yyyy}-%i.log appender.APIM_METRICS_APPENDER.layout.type = PatternLayout appender.APIM_METRICS_APPENDER.layout.pattern = %d{HH:mm:ss,SSS} [%X{ip}-%X{host}] [%t] %5p %c{1} %m%n appender.APIM_METRICS_APPENDER.policies.type = Policies appender.APIM_METRICS_APPENDER.policies.time.type = TimeBasedTriggeringPolicy appender.APIM_METRICS_APPENDER.policies.time.interval = 1 appender.APIM_METRICS_APPENDER.policies.time.modulate = true appender.APIM_METRICS_APPENDER.policies.size.type = SizeBasedTriggeringPolicy appender.APIM_METRICS_APPENDER.policies.size.size=1000MB appender.APIM_METRICS_APPENDER.strategy.type = DefaultRolloverStrategy appender.APIM_METRICS_APPENDER.strategy.max = 10 -
Add a reporter to the loggers list:
loggers = reporter, ...(list of other available loggers) -
Add the following configurations after the loggers:
logger.reporter.name = org.wso2.am.analytics.publisher.reporter.elk
logger.reporter.level = INFO
logger.reporter.additivity = false
logger.reporter.appenderRef.APIM_METRICS_APPENDER.ref = APIM_METRICS_APPENDER
Note
The apim_metrics.log file be rolled each day or when the log size reaches the limit of 1000 MB by default. Note that only 10 revisions will be kept and older revisions will be deleted automatically. You can change these configurations by updating the configurations provided in step 2 of this section given above.
Step 2 - Configuring DataDog
Before you begin, an application Key should be generated following the steps in this documentation.(Do not assign any scopes while creating the key)
Step 2.1 - Configure Datadog Agent
Follow the steps here to configure the Datadog Agent to read and publish the apim_metrics.log file.
Step 2.2 - Create Log Pipeline
The published have to be pre-processed and extracted the attributes so that facets and measures can be created to generate dashboards and widgets.
To create the log pipeline, execute the following curl command providing the API Key and the Application Key to invoke the Log Pipeline Rest API.
curl --location --request POST 'https://api.datadoghq.com/api/v1/logs/config/pipelines' \
--header 'Content-Type: application/json' \
--header 'Accept: application/json' \
--header 'DD_API_KEY:  <API_KEY>\
--header 'DD_APPLICATION_KEY: <APPLICATION_KEY>\ \
--data-raw '{
 "filter": {
   "query": "source:apim_node"
 },
 "is_enabled": true,
 "name": "PreProcessing",
 "processors": [
   {
     "is_enabled": true,
     "grok": {
       "support_rules": "",
       "match_rules": "rules_1 %{date(\"HH:mm:ss,SSS\")}%{regex(\"[^a-zA-Z0-9]*\\\\w+[^a-zA-Z0-9]*\\\\w+[^a-zA-Z0-9]*\\\\w+ \\\\w+ [a-zA-Z0-9]*[^a-zA-Z0-9]*\\\\w+[^a-zA-Z0-9]\")}%{regex(\"\\\\w+\"):eventType}%{regex(\"[^a-zA-Z0-9]* \\\\w+ [^a-zA-Z0-9]\")}%{data::json}\n"
     },
     "name": "Grok Parser",
     "source": "message",
     "samples": ["08:23:34,898 [-] [PassThroughMessageProcessor-188]  INFO ELKCounterMetric apimMetrics: apim:response, properties :{\"apiName\":\"PizzaShackAPI\",\"proxyResponseCode\":200,\"destination\":\"https://localhost:9443/am/sample/pizzashack/v1/api/\",\"apiCreatorTenantDomain\":\"carbon.super\",\"platform\":\"Other\",\"apiMethod\":\"GET\",\"apiVersion\":\"1.0.0\",\"gatewayType\":\"SYNAPSE\",\"apiCreator\":\"admin\",\"responseCacheHit\":false,\"backendLatency\":3,\"correlationId\":\"02951f10-5934-456d-b608-7cd85b3f7c9d\",\"requestMediationLatency\":1,\"keyType\":\"SANDBOX\",\"apiId\":\"af88b5f8-594a-4f57-a729-7eb86b6a63ab\",\"applicationName\":\"DefaultApplication\",\"targetResponseCode\":200,\"requestTimestamp\":\"2022-12-15T02:53:34.894Z\",\"applicationOwner\":\"admin\",\"userAgent\":\"curl\",\"userName\":\"admin@carbon.super\",\"apiResourceTemplate\":\"/menu\",\"responseLatency\":4,\"regionId\":\"default\",\"responseMediationLatency\":0,\"userIp\":\"127.0.0.1\",\"apiContext\":\"/pizzashack/1.0.0\",\"applicationId\":\"87c8da4c-aa3f-43d3-89ac-dc3dc3b19d3e\",\"apiType\":\"HTTP\",\"properties\":{}}"],
     "type": "grok-parser"
   }
 ]
}'
After creating the above pipeline, invoke a few APIs through API Manager to generate few Analytics events(both Success and Faulty events have to be generated).
The published analytics events will be available in Logs -> Search view on the DataDog web UI.
Step 2.3 - Create Facets and Measures.
Facets
For the following attributes, create facets by following this documentation.
| Attribute | Description |
|---|---|
apiContext |
The base path of the API (e.g., /pizzashack/1.0.0) |
apiCreator |
Username of the user who created the API |
apiName |
Name of the API being invoked |
apiType |
Type of API protocol (e.g., HTTP, WEBSOCKET, GRAPHQL) |
apiVersion |
Version of the API being invoked |
apiResourceTemplate |
The resource path template that was matched (e.g., /menu, /order/{id}) |
apiMethod |
HTTP method used for the API call (GET, POST, PUT, DELETE, etc.) |
applicationName |
Name of the application making the API call |
applicationOwner |
Username of the user who owns the application |
errorType |
Type of error that occurred (only present in fault events) |
eventType |
Type of analytics event (response, fault, throttle, etc.) |
destination |
Backend service endpoint URL |
platform |
Platform information from user agent (Android, iOS, Windows, etc.) |
responseCacheHit |
Boolean indicating whether the response was served from cache |
userAgent |
User agent string from the API request |
userName |
Username of the authenticated user making the API call |
userIp |
IP address of the client making the API request |
Measures
Create measures for the following attributes to enable numerical analysis and aggregations:
| Attribute | Type | Unit | Description | Calculation |
|---|---|---|---|---|
backendLatency |
Integer | Milliseconds | Time taken by the backend service to process the request | Measured from when the request is sent to backend until response is received |
responseLatency |
Integer | Milliseconds | Total time taken to process the API request | Sum of request mediation latency + backend latency + response mediation latency |
responseMediationLatency |
Integer | Milliseconds | Time taken by API Manager to process the response | Measured during response flow mediation (transformations, policies, etc.) |
requestMediationLatency |
Integer | Milliseconds | Time taken by API Manager to process the request | Measured during request flow mediation (authentication, rate limiting, transformations, etc.) |
targetResponseCode |
Integer | None | HTTP response code returned by the backend service | Raw HTTP status code from backend (200, 404, 500, etc.) |
proxyResponseCode |
Integer | None | HTTP response code returned by API Manager to client | Final HTTP status code sent to client (may differ from backend if transformed) |
errorCode |
Integer | None | Internal error code for faults | WSO2-specific error codes for different types of failures |
Step 2.4 - Import Dashboards
Import the dashboards.zip following the steps here.